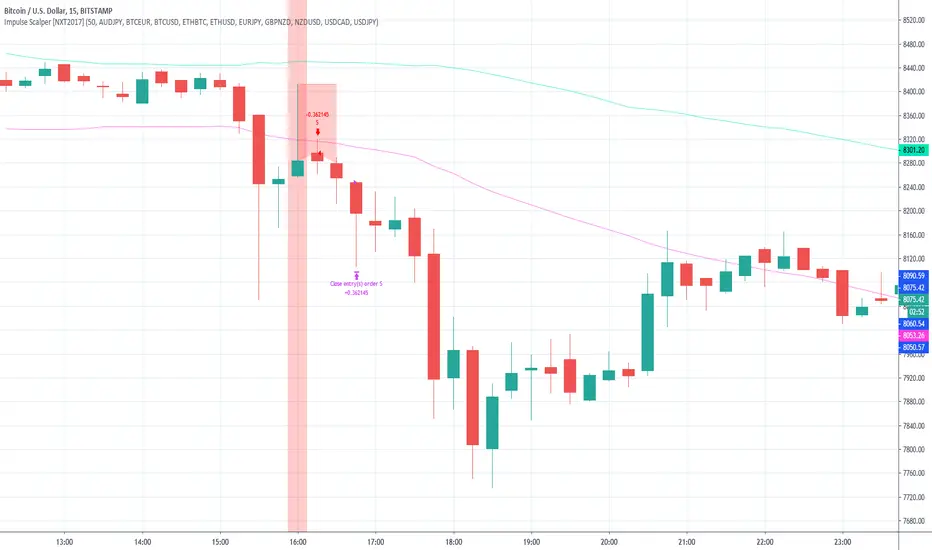
Impulse Scalper [NXT2017] - with included market scannerPrivate Indicator.
HI BIG PLAYERS,
with this indicator it is possible to analyze small rebound effects in the trading market and to scalp the movement into the trend again.
HOW IT WORKS
Hereby the indicator use a candleformation with a huge wick inside of a band, based on a Simple Moving Average on the 50 highs and 50 lows.
A signal is shown with vertical red/green background around the bar for selling/buying. Furthermore, the high/low of the signal serves as StopLoss line and makes a horizontal red line inside the active trading time. The trade is to closing if the second candle after the signal is finished.
For example:
1. candle => signal
2. candle => entry on open price with the SL
3. candle => nothing to do
4. candle => close your trade after candle 3 is finished
For the analysis I have set the following settings:
Initial Capital: 100 000 (the default setting)
Base Currency: USD
OrderSize: 3% of equity
Pyramiding: 1 orders
Commission 0%
Verify Price For Limit Orders: 0 ticks
Slippage 0 ticks
Recalculate:
After Order is Filled (deactived)
On Every Tick (deactived)
A market scanner is also integrated in this indicator. Since good signals rarely occur in a market, the market scanner allows up to 10 markets to browse for the signals simultaneously. My favorite markets are currently selected as default.
The 10 default markets are:
AUDJPY
BTCEUR
BTCUSD
ETHBTC
ETHUSD
EURJPY
GBPNZD
NZDUSD
USDCAD
USDJPY
Market Scanner in action (in the settings you can also hide the labels):
Of course, alerts are also possible with the TradingView Alerts system. For example it's possible to get a message per signal to your e-mail, that you use on TradingView.
Access to the indicator: use the link below, thanks for your attention!
Kind regards
NXT2017
Search in scripts for "high low"
Breakout Reversal Entry on WMA - NG1! Overnight ver 1This script is for learning purposes only
This strategy will plot arrows when price breaks so far above/below WMA. The strategy will enter when the price breaks away from WMA. All entries are reversals. Users can set WMA length and source; also the distance of the price away from WMA to enter. Adjustable bracket orders are placed for exit, with trailing stop or market stop choice. Last, users can set the time of day they want to enter a trade.
My Preference: I am testing this strategy on NG1! over night on 1 minute candle. with .003 on price drop/climb, I get entries almost every night. Also 10 tick stop and 5 tick profit seems backward to most, but with a high win/loss ratio, it performs quite well. Trailing stops generally help out as well.
INPUTS:
Length - The is the WMA length
Source - WMA source (High, Low, Open, Close...)
When Price Drops - This is the distance in ticks when the price drops away from WMA, an arrow is plotted, and reversal entry order is placed
When Price Climbs - Same as price drop, just in the opposite direction
Trailing Stop check box - Check if you want to place a trailing stop so many tick away from entry. Unchecked is Market (hard) stop so many ticks from entry.
Stop - Number of ticks away from entry a the stop or trailing stop is set (for NG 1 tick = $0.001)
Limit Out - Number of ticks away from entry a limit order is placed to take profits
Limit Time of day check box - check to use the time of day to limit what time of day order entry will occur.
Start/Stop Trades (Est Time) - First box is when the strategy will be allowed to start buying and stop is when the strategy will stop being allowed to buy. Sell orders continue until a stop or limit triggers an exit. These times are Eastern time zone
PROPERTIES:
Pyramiding - This feature will allow multiple entries to occur. If set to 1, the strategy should only trade 1 contract at a time. If set to 2, the strategy will enter a second order if entry requirements are met. This allows you to be holding 2 contracts. Basically on a good day, it will multiply your earnings, on a bad day, you'll just lose more. For testing, I keep this on 1.
TIPS:
- If you want to go long only, set "When Price Climbs" to an impossible number, like 10,000. It's not possible for NG to move $10 is a matter of minutes so it will not enter the market with a short order. Also keep in mind you can set different requirements for going long vs going short. If you think there is more pull on the market in a particular direction.

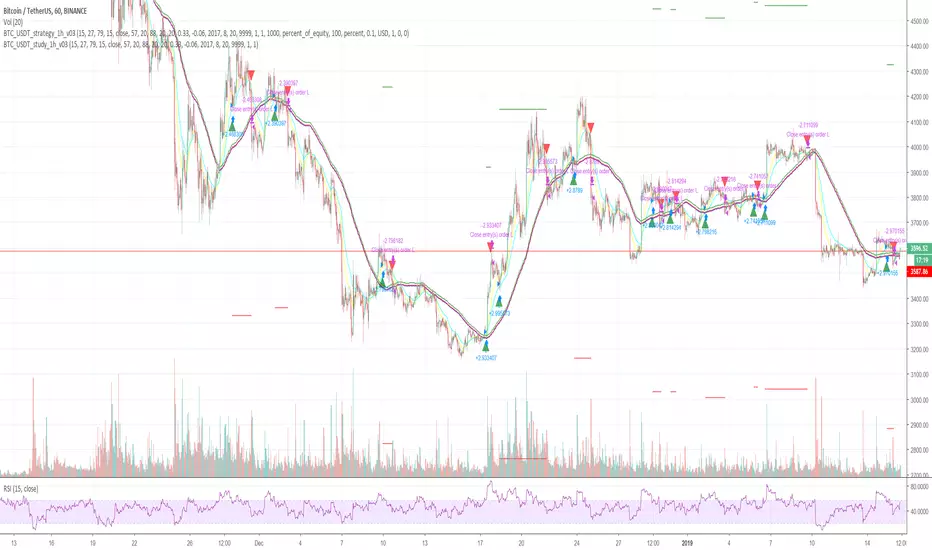
Cryptocurrency trend following EMA Ribbon LONG only strategyThis strategy is based on EMA Ribbon and uses multiple indicators to find optimal time to enter/exit the trade and filter out false signals. The script with default setting is developed mainly for trading altcoins/stable coin pair such as ADA/USDT etc on 4h timeframe but it can be applied to any pair/any timeframe with some settings adjustments.
For plot on chart features make sure that you have both study and strategy scripts on chart with same settings.
Strategy settings description:
1. Signal EMA Length - Value for exponencial moving average (slowest from EMA Ribbon)
1a. Buy price toleration (%) - Price deviation for filtering bounces of EMA - price must close defined percents above EMA to open long trade
1b. Sell price toleration (%) - Price deviation for filtering bounces of EMA - price must close defined percents bellow EMA to close long trade
1c. EMA deelay - EMA id delayed by defined bars for smoothening
2. Filter by Fast EMA - Strategy filters signals to prevent buy while coin is dropping
2a. Fast EMA Length - Value for fast exponencial moving average
3. Filter by SMA - Strategy filters signals to confirm trend change
3a. SMA Length - Value for simple moving average
4. Filter by RSI - Strategy filters signals to prevent buing/selling overbought/oversold coins
4a. RSI Length - Length of RSI identificator
4b. RSI Source candle - What price of candle is used for RSI calculation (open, close, high, low)
4c. RSI Long condition - When buy, RSI indicator must be below this value to prevent of buying already overbought coin
4d. RSI Short condition - When sell, RSI indicator must be above this value to prevent of selling already oversold coin
5. RSI Close Trade Condition - Strategy sell coin once RSI reach defined value
5a. RSI close trade condition - Sell once RSI indicator acquires defined value
6. Close trade by Take Profit or Stop Loss Condition (STRATEGY ONLY) - Strategy sell coin once defined take profit / stoploss level is reached
6a. Take Profit (%) - Take profit value in percent
6b. Stop Loss (%) - Stop loss value in percent
6c. Plot targets on chart - defined targets will be plotted as lines on chart
7. Date range from
7a From Year - To run strategy in interval
7b From Month - To run strategy in interval
7c From Day - To run strategy in interval
8. Date range to
8a To Year - To run strategy in interval
8b To Month - To run strategy in interval
8c To Day - To run strategy in interval
9. Wait to confirm the signal
9a Wait candless to buy - strategy will wait defined candless to confirm the signal before buy
9b Wait candless to sell - strategy will wait defined candless to confirm the signal before sell
10. Plotting on chart (STUDY ONLY)
10a Plot signal line channel with bows on chart
10b Plot simple moving average on chart
10c Plot EMA Ribbon on chart
10d Plot recent support and resistance levels on chart
11. Show Every signal (STUDY ONLY) - Unchecked shows only first signal based on strategy. But if you use take profit/stoploss settings within your bot, you might want to rebuy on next signal. Checked shows signal on each candle.
Throw on chart also buld-in RSI indicator and set the same as strategy
Notice that there might be false signals, especially when the coin is not trending or is strongly manipulated. Overall strategy is profitable though. You just take some minor loses and wont miss the big move.
You may also consider to compare buy&hold return vs profit from trading this strategy. In downtrend as we have seen recently, profit may not be as high as you expect but it is still much better than just hold and hope.
You can use the strategy script for fine tunning settings and find best settings for yourself.
Study script helps you to automate trading with use of alerts perharps with 3commas bot or even trade manually based on email/sms notification setted by tradingview
Notice that study script does not handle takeprofit/stoploss order. That is why sell arrows could be plotted by study script later than strategy script. To rebuy after takeprofit/stop-loss use "11. Show Every signal (STUDY ONLY)" setting
Make sure that you keep same settings for strategy and study scripts.
If you need any help with settings do not hesitate to ask. I would also appriciate any feedback and ideas how to improve this script.
Here is backtest result from 1. Nov 2018 using constant 100USD Buy ammount:

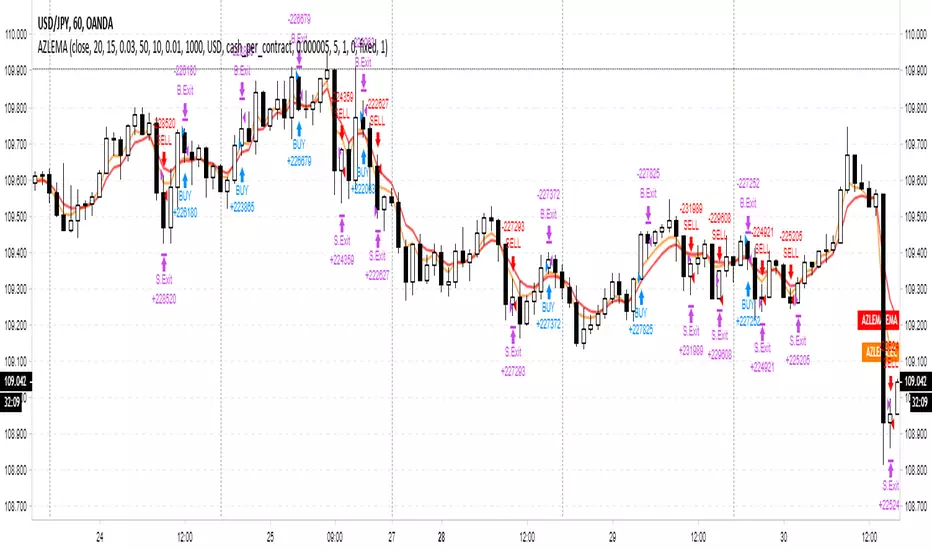
Adaptive Zero Lag EMA Strategy [Ehlers + Ric]Behold! A strategy that makes use of Ehlers research into the field of signal processing and wins so consistently, on multiple time frames AND on multiple currency pairs.
The Adaptive Zero Lag EMA (AZLEMA) is based on an informative report by Ehlers and Ric .
I've modified it by using Cosine IFM, a method by Ehlers on determining the dominant cycle period without using fast-Fourier transforms
Instead, we use some basic differential equations that are simplified to approximate the cycle period over a 100 bar sample size.
The settings for this strategy allow you to scalp or swing trade! High versatility!
Since this strategy is frequency based, you can run it on any timeframe (M1 is untested) and even have the option of using adaptive settings for a best-fit.
>Settings
Source : Choose the value for calculations (close, open, high + low / 2, etc...)
Period : Choose the dominant cycle for the ZLEMA (typically under 100)
Adaptive? : Allow the strategy to continuously update the Period for you (disables Period setting)
Gain Limit : Higher = faster response. Lower = smoother response. See for more information.
Threshold : Provides a bit more control over entering a trade. Lower = less selective. Higher = More selective. (range from 0 to 1)
SL Points : Stop Poss level in points (10 points = 1 pip)
TP Points : Take Profit level in points
Risk : Percent of current balance to risk on each trade (0.01 = 1%)
www.mesasoftware.com
www.jamesgoulding.com(Measuring%20Cycles).doc
Cryptocurrency trend following LONG only strategyThis strategy uses multiple indicators to find optimal time to enter/exit the trade. The default setting is mainly for trading bitcoin/stable coin pair such as USDT etc on 1h timeframe but it can be applied to any pair/any timeframe with some settings adjustments.
Strategy settings description:
ID Name Descrption
1 FastMA - Value for fast exponencial moving average
2 SlowEMA - Value for slow exponencial moving average
3 SMA - Value for simple moving average
4 RSI Length - Length of RSI identificator
5 RSI Source candle - What price of candle is used for RSI calculation (open, close, high, low)
6 RSI Long condition - When buy, RSI indicator must be below this value to prevent of buying already overbought coin
7 RSI Short condition - When sell, RSI indicator must be above this value to prevent of selling already oversold coin
8 RSI close trade condition - Sell once RSI indicator acquires defined value
9 Take Profit (%) - Take profit value in percent
10 Stop Loss (%) - Stop loss value in percent
11 Long price toleration (%) - Price deviation for filtering bounces of simple moving average - price must close defined percents above SMA to open long trade
12 Short price toleration (%) - Price deviation for filtering bounces of simple moving average - price must close defined percents bellow SMA to close long trade
13 From Year - To run strategy in interval
14 From Month - To run strategy in interval
15 From Day - To run strategy in interval
16 To Year - To run strategy in interval
17 To Month - To run strategy in interval
18 To Day - To run strategy in interval
19 Show every signal? - (Study only) Unchecked shows only first signal based on strategy. But if you use take profit/stoploss settings within your bot, you might want to rebuy on next signal. Checked shows signal on each candle.
Notice that there are also false signals, especially when the coin is not trending or is strongly manipulated. Overall strategy is profitable though. You just take some minor loses and wont miss the big move.
You may also consider to compare buy&hold return vs profit from trading this strategy. In downtrend as we have seen recently, profit may not be as high as you expect but it is still much better than just hold and hope.
You can use the strategy script for fine tunning settings and find best settings for yourself
Study script helps you to automate trading with use of alerts perharps with 3commas bot or even trade manually based on email/sms notification setted by tradingview
Make sure that you keep same settings for strategy and study scripts.
If you need any help with settings do not hesitate to ask. I would also appriciate any feedback and ideas how to improve this script.
Here is backtest result from 23.08.2017:
Strategy - Bobo's Pivot ATR SwingHi there, welcome to my pivot ATR swing bot. I put this out there with source code hidden to see what ideas others have to use it. Also if there are any coders of trading systems out there who wanted to work with me to put this into a form that could trade automatically we could both use... I'd welcome that kind of collaboration and will happily share the underlying rules of this and the more highly developed version that isn't public.
But as it is, the signals are free for all, use them as you wish and at your own risk. If you want to discuss the code, strategy or ideas, I'm around fairly regularly just message.
The bot is fairly simple design that will give you signals for long and short intraday/week on equity futures / CFDs / ETFs. You'll see it backtests fairly well on an hourly SPX500 chart as configured. You will need to set up certain parameters to account for any different timeframes and markets you wish to trade. For me it's most effective pick out a few good swing trades per week in equity futures. However part of the idea of putting this in the public domain is to see if other people will have good but different ideas how to use it. Please share with me if so :).
The basic concept is a series of 3 lines that define the area and movement we wish to trade. The daily pivot is the central line (blue). We are looking to capture reversions to this middle line from extremes (red and green). Therefore the bot will signal exit at the close of every candle that has passed through the pivot.
Entry is decided by the outer bands around the blue line. Red is the top band, green the bottom. As configured, these are simply placed a daily ATR value apart, centred around the pivot. You can change this quite a lot though, so let's go through the settings:
Pivot Timeframe - simple, a daily pivot is calculated from the previous day's values (high + low + close)/3 . BUt the same calculation can be applied to any length candle, day, minute, month or whatever. This makes the middle target line more or less responsive to recent price action.
ATR Band Timeframe - When we calculate the average range, we need to know what candle length makes up our series. Daily candles is the default, but you can change that here.
ATR Lookback - When we calculate the average range, we need to know how many instances of the timeframe (day, minute, hour etc) we look back to create an average. The lower the lookback value, the more the width of the bands (the distance from pivot) will change quickly based on the volatility of previous candles. The higher the lookback value, the more stable the band width will be to recent volatility.
ATR divisor - The ATR value above is divided by this value, before being added or subtracted to the pivot to create the red and green lines. Default value is 2, and this means the distance from the red band to the green band will be equal to 1 ATR, as calculated according to the parameters above. Setting this to 1 would mean that each band is one ATR away from pivot (ie the bands got wider apart). Set this to 4, and it means that it is only 1/2 an ATR from green to red.
Take Profit / Stop Loss. - We know what a stop and profit target are, but worth nothing that a 0 value disables stop loss or profit targets. The bot will still close positions when crossing pivot.
Also, note the mintick value of the instrument you apply this to. For example for the CFD chart SPX500 the mintick value is 0.1. So a 100 value for stop loss = 10 points on SPX500. but if you were to trade the same thing basically, but the emini future ES, the mintick value is 0.25. So for a 10 point stop on the ES chart, you would need a value of 40 in this bot. US30 and YM have convenient mintick values of 1. Currencies can be a bit of a nightmare :).

🤙 chill_bro 🤙This is the chill_bro momo strat using a simple cross/over mean reversion. Draw down is high, ~50%, but bitcoin has already declined more than 50% from it's peak value, so it's already outperforming buy and hold on that front as well.
Two inputs here:
Fast daddy
Slow daddy
change inputs to tune the strategy, based on two your choice of open/close/high/low/olhc/olh/etc
🤙🤙🤙

--0-- Base Estrategias 4.0Universal Strategy Builder is an advanced multi-purpose trading engine designed for traders who want to build, test, and automate complete systems without writing Pine Script.
This tool combines multiple entry logics, dynamic filters, risk-management modules, and configurable exit conditions into a single framework.
It is not a “signal indicator.”
It is an infrastructure layer for creating strategies on any market and timeframe.
Key Features
• Entry Modules
Moving Average Cross
RSI-based setups
MACD setups
Chandelier Exit logic
Custom filters for trend, momentum and volatility
Multi-filter stacking (MA, RSI, MACD, AO, custom conditions)
• Risk Management
Percentage-based Stop Loss
ATR-based Stop Loss
Swing High/Low stop logic
Candle-based cancellation rules
Close-on-reversal option
• Take Profit System
Multiple TP levels
Percentage or ATR-derived targets
Multi-stage position scaling
Optional trailing stop with custom activation and distance
• Full MA Suite
6 independent moving averages
EMA/SMA/WMA/RMA
Flexible period and source selection
• Oscillator Suite
RSI (with OB/OS triggers and cross filters)
MACD with adjustable smoothing
Awesome Oscillator
Multi-timeframe filter options
• Bot-Ready
Designed to work seamlessly with:
Webhooks
External automation platforms
Copy-trading engines
Strategy replicators
Who Is This For?
This tool is intended for traders who want to:
Develop systematic strategies
Optimize entry/exit conditions
Combine multiple confirmation layers
Backtest ideas without coding
Build bot-ready setups quickly and consistently
Important Notes
This is a professional toolkit.
It does not predict the market or guarantee profitable results.
Performance depends entirely on how the user configures the system, market conditions, risk parameters, and execution quality.
Access
This script is provided as invite-only.
Please contact the author if you would like to request access.

SenxseAiSenxseiAI is a fully modular, multi-framework trading system designed for precision, clarity, and ease of use.
This tool blends market structure, dynamic S/R mapping, trend-logic, and session-based liquidity levels into a unified visual workflow. It highlights real-time entry signals with clean rays and labeled flags, while optional session, daily, and weekly highs/lows anchor traders to key liquidity points. A comprehensive theme engine—with multiple color packs and custom overrides—allows the interface to adapt to any chart style or user preference.
The UI is intentionally minimal, using toggle-based controls instead of overwhelming parameter lists, making the script beginner-friendly while maintaining professional depth.

Fibo Tarayıcı + Mirror + Bot
KEY FEATURES:
1. Fibonacci Levels: Plots 23.6%, 38.2%, 50%, 61.8%, 78.6%, 88.6%, 100%, 127.2%, 141.4%, 161.8% levels
2. Mirror Fibonacci: Shows reverse extensions of main levels
3. Auto Trading System: Executes automatic trades at specified Fibonacci levels
4. Multi-Symbol Scanner: Scans 120+ crypto and stock symbols
5. Visual Alerts: Colored background and labels when price approaches Fibonacci levels
HOW IT WORKS:
1. Finds swing high/low points over 144 bars
2. Calculates Fibonacci levels between these points
3. Generates buy/sell signals when price approaches these levels
4. User can select which levels to trade
5. Scanner shows Fibonacci signals across multiple symbols

Dami's HMA Strategy"Dami's HMA Strategy: Dynamic Crossover with Momentum Filter"
Key Points to Include:
Foundation: The strategy is based on the Hull Moving Average (HMA), noted for its speed and reduced lag, making it ideal for identifying trend inflection points early.
Enhanced Logic: Unlike a simple moving average crossover, this strategy incorporates a momentum filter. A signal is only triggered if the HMA crossover coincides with a candle moving in the direction of the new trend (bullish candle for Long, bearish candle for Short). This aims to confirm the impulse and avoid false entries during consolidation periods or 'weak' crossovers.
100% Market Coverage System: It is a continuous reversal system. Every new signal (Long or Short) closes the opposite position, ensuring the trader is always positioned in the direction indicated by the HMA.
Complementary Visualization: It includes the 8-Period High/Low Bands (Dami's Bands) to provide visual context of the recent price range, although they do not affect trading orders.
Adjustment and Optimization: The HMA length (hma_len=9 by default) is the key parameter to optimize based on the specific pair and timeframe. Higher values will generate fewer signals and be slower, while lower values (like the current 9) make it more sensitive.

SMC MTF + FVG + Trailing TP 100% [FIXED]Component Description
Entry Timeframe: H1
Trend Filter: D1 (EMA50 vs EMA200)
Trend Filter Only enter BUY orders if EMA50 > EMA200 on D1 (uptrend)
Only enter SELL orders if EMA50 < EMA200 (downtrend)
Break of Structure (BOS) Identify the previous swing high/low breakout point
Order Block (OB) The candle area before BOS is marked with an orange box
Fair Value Gap (FVG) Check for the presence of a price gap to confirm Entry
Trailing TP Trigger trailing after reaching the desired R (in pips or ATR)

Risk-Managed StrategyRisk-Managed Strategy is a complete algorithmic trading framework that blends multiple technical systems—RSI, MACD, EMA crossover, Bollinger Bands, and SuperTrend—into a unified signal engine.
The script dynamically calculates position size based on capital, risk percentage, ATR-based stop loss, and reward-ratio targets.
It features:
-Multi-indicator signal voting (BUY / SELL / NEUTRAL)
- Dynamic capital tracking across trades
- Automatic position sizing based on risk amount
- Auto-generated Stop Loss and Take Profit using recent highs/lows
- On-chart SL, TP, and CMP plotting for clarity
This strategy is designed for traders who want a professional, rule-based system that balances accuracy, risk control, and automation.
Disclaimer:
The information provided is for educational and informational purposes only. It does not constitute financial or investment advice. Trading and investing in stocks involves risk, including the possible loss of capital. Any decisions to buy, sell, or hold securities are the sole responsibility of the reader. Past performance is not indicative of future results. Always do your own research and, if necessary, consult with a licensed financial advisor before making investment decisions.

Fractal Break Strategy with Time FilterThis strategy isn't complete yet but just curious how fast they will take it down. It is based off breaks of fractals and then taking the High/Low of the break candle

PDHL Breakout SMA50 By Ajit TiwariThis indicator help you to find buy sell from previous day high low basis

AlgoWay GRSIM🧭 What this strategy tries to do
This strategy detects when a market move is losing strength and prepares for a potential reversal, but it waits for fresh momentum confirmation before acting.
It combines:
• RSI-based divergence (to spot exhaustion and potential turning points),
• Impulse MACD (to verify that the new direction actually has force behind it).
________________________________________
⚙️ When it takes trades
Long (Buy):
• A bullish RSI divergence appears (a clue that selling pressure is fading);
• Within a short time window, the Impulse MACD turns strongly positive;
• Optionally, the impulse line itself must be rising (if the Impulse Direction Filter is
enabled).
Short (Sell):
• A bearish RSI divergence appears (buying pressure fading);
• Within a short time window, the Impulse MACD turns strongly negative;
• Optionally, the impulse line must be falling (if the Impulse Direction Filter is enabled).
If momentum confirmation happens too late, the divergence “expires” and the signal is ignored.
________________________________________
🧩 How entries work
1. Reversal clue:
The strategy detects disagreement between price and RSI (price makes a new high/low, RSI doesn’t).
That suggests a shift in underlying strength.
2. Momentum confirmation:
Before entering, the Impulse MACD must agree — showing real push in the same direction.
3. Impulse direction filter (optional):
When enabled, the impulse itself must accelerate (rise for longs, fall for shorts), avoiding fake signals where price diverges but momentum is still fading.
4. No stacking:
It opens only one position at a time.
________________________________________
🚪 How exits work
Two main exit styles:
Conservative (default):
Longs close when impulse crosses below its signal line.
Shorts close when impulse crosses above its signal line.
✅ Keeps trades as long as momentum agrees.
Color-change (fast):
Longs close immediately when impulse flips bearish.
Shorts close immediately when impulse flips bullish.
⚡ Faster and more defensive.
Plus:
Stop Loss (%) and Take Profit (%) act as fixed-distance protective exits (set to 0 to disable either one).
________________________________________
📊 What you’ll see on the chart
A thick Impulse MACD line and thin signal line (oscillator view).
Diamonds — detected bullish/bearish divergence points.
Circles — where impulse crosses its signal (momentum change).
A performance panel (top-right) showing Net Profit, Trades, Win Rate, Profit Factor, Pessimistic PF, and Max Drawdown.
________________________________________
🔧 What you can tune
Signal Lifetime (bars): how long a divergence remains valid.
Impulse Direction Filter: ensure the impulse itself is moving in the trade’s direction.
Stop Loss / Take Profit (%): risk and target in percent.
Exit Style: conservative cross or faster color-change.
RSI / MA / Signal Lengths: adjust responsiveness (defaults are balanced).
________________________________________
💪 Strengths
Confirms reversals using momentum direction, not just divergence.
Avoids “early” signals where momentum is still fading.
Works symmetrically for longs and shorts.
Built-in stop/target protection.
Clear, visual confirmation of all logic components.
________________________________________
⚠️ Things to keep in mind
In sideways markets, the impulse can flip often — prefer conservative exits.
Too small SL/TP → constant stop-outs.
Too wide SL/TP → deep drawdowns.
Always test with different timeframes and markets.
________________________________________
💡 Practical tips
Start with default settings.
Enable “Use Impulse Direction Filter” in trending markets, disable it in very choppy ones.
Focus on Profit Factor, Win Rate, and Max Drawdown after several dozen trades.
Keep SL/TP roughly aligned with typical swing size.
“AlgoWay GRSIM” is a reversal-with-confirmation strategy: it spots likely turns, demands real momentum alignment (optionally verified by impulse direction), and manages exits with clear momentum cues plus built-in protective limits.

SabinaCounter-trend strategy working only in long.
Principle of Operation
The strategy is based on market extremes, which serve as both the signals for opening a position and for closing it. These extremes possess data such as Open, High, Low, Close, and others. The length and the shift (positive or negative) of the extremes are also configurable.
The extreme Ext is used for closing the position, and the extreme Ent is used for opening the position.
Base Order
A dedicated percentage of the deposit is specified. If the price crosses the Ent extreme, a long position is opened.
Take Profit and Stop Loss
The Take Profit level is calculated from the average price. A trailing stop order is present by default, which is set by the Ext extreme. When the price crosses this extreme, the position will be closed if the Take Profit has not yet been reached.
Grid of Orders (Averaging)
This section allows for enabling or disabling the grid of orders.
In the order grid, you can specify the percentage below the base order at which the grid's limit orders should be placed. The grid step is also configurable. The leverage for all orders, including the base order, is set here.
The order grid consists of 10 orders, and each order can be assigned its own percentage of the deposit. This gives the strategy greater flexibility compared to a standard DCA (Dollar-Cost Averaging) grid.
Information Panel
A table displays the historical price drop at a given moment, providing some insight into the potential liquidation level based on the selected leverage. The table also shows the deposit utilization (how much of the deposit is currently tied up).

Camarilla Pivots + 20 EMA StrategyThis is an intraday volatility and trend-following system for commodities like Natural Gas, combining dynamic pivot levels (Camarilla) with a trend filter (20-period EMA) to improve risk-reward and reduce false breakouts.
Core Components
1. Camarilla Pivots:
These are special support and resistance levels (H3, H4, L3, L4) calculated each day based on the previous day's high, low, and close.
The pivots adapt to daily volatility, giving more relevant breakout and bounce zones than static lines.
H4: Aggressive resistance (used for breakout LONG entry)
H3: Moderate resistance/support (used for bounce or stoploss)
L4: Aggressive support (used for breakout SHORT entry)
L3: Moderate support/resistance (used for bounce or stoploss)
2. 20 EMA (Exponential Moving Average):
Plotted on the 30-minute chart, this acts as a trend filter.
If the price is above 20 EMA: Only look for long trades (bullish bias).
If below 20 EMA: Only look for short trades (bearish bias).
How the Strategy Works
Setup (30-Min Chart):
Camarilla pivots for the day are drawn on the chart.
20 EMA is also plotted.
Trade Filter:
Bullish: Trade ONLY if price is above 20 EMA.
Bearish: Trade ONLY if price is below 20 EMA.
Entry:
LONG: Enter when price breaks and closes above the H4 pivot AND is above 20 EMA.
SHORT: Enter when price breaks and closes below the L4 pivot AND is below 20 EMA.
Stop Loss:
LONG: Place stoploss at H3 (the next lower Camarilla resistance).
SHORT: Place stoploss at L3 (the next higher Camarilla support).
Target:
Always set a profit target at 2x the distance (risk) between entry and stoploss (strict R:R 2).
For example, if your entry is at H4 and stoploss at H3, your target is entry + 2*(entry - stoploss).
Alerts & Visuals:
The strategy plots entry arrows, stoploss and target lines for immediate visual reference.
Alerts trigger on breakout signals so you never miss a trade.
Why This Works Well for Natural Gas
Adapts to volatility: The pivots change daily, handling wide-ranging and choppy price moves better than fixed breakouts.
Trend filter: EMA prevents counter-trend whipsaws, only trades with market momentum.
Risk control: Every trade must meet strict risk-reward criteria, so losses are contained and winners can outweigh losers.

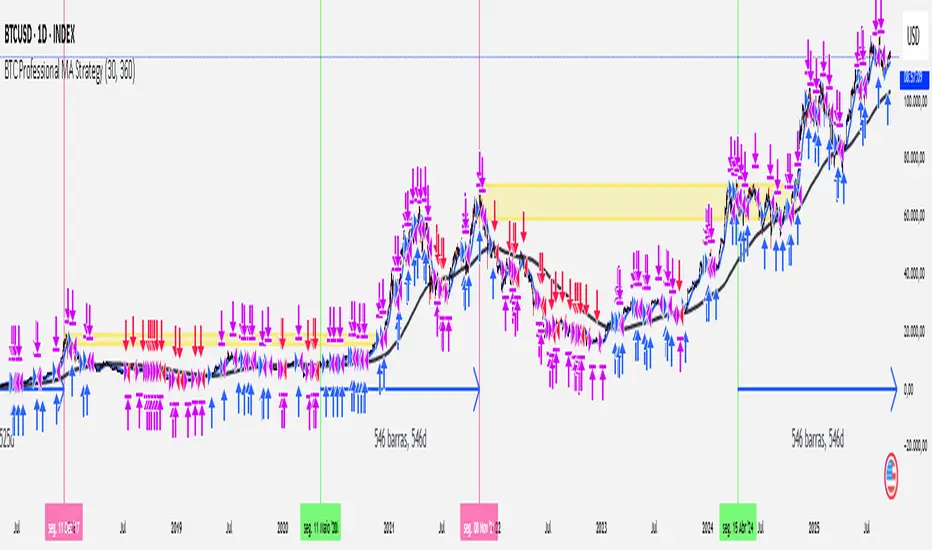
[Outperforms Bitcoin Since 2011] Professional MA StrategyThis Strategy OUTPEFORMS Bitcoin since 2011.
Timeframe: Daily
MA used (Fast and Slow): WMA (Weighted Moving Average)
Fast MA Length: 30 days (Reflects the Monthly Trend - Short Term Perspective)
Slow MA Length: 360 days (Reflects the Annual Trend - Long Term Perspective)
Position Size: 100% of equity
Margin for Long = 10% of equity
Margin for Short = 10% of equity
Open Long = Typical Price Crosses Above its Fast MA and Price is above its Slow MA
Open Short = Typical Price Crosses Below its Fast MA and Price is below its Slow MA
Close Long = Typical Price Crosses Below its Fast MA
Close Short = Typical Price Crosses Below its Fast MA
note: Typical Price = (high + low + close) / 3
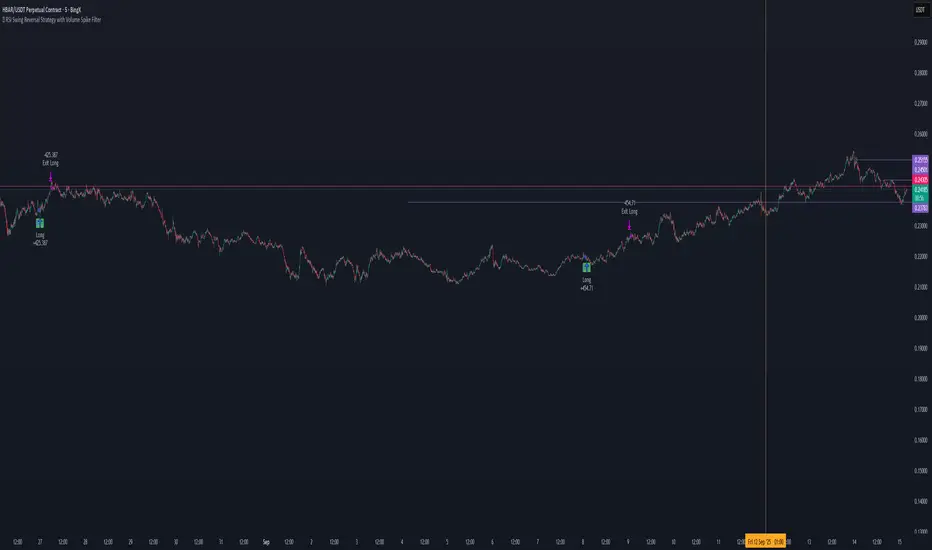
📊 RSI Swing Reversal Strategy with Volume Spike FilterHi , i did test that on Hbar time frame 5min. please let me know if i did miss something .85% win rate. please get back test.
What Will This Strategy Do?
Use RSI cross over/under its MA + Swing High/Low + optional Trend Filter.
Enter long on bullish signals.
Enter short on bearish signals.
Exit on opposite signals or optional take-profit/stop-loss.
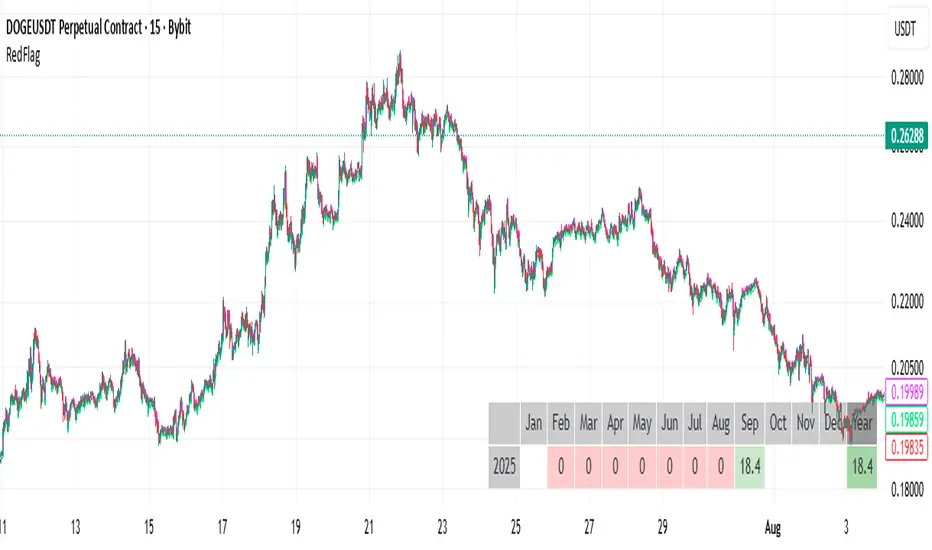
RedFlagCounter-trend strategy
Condition to open a long position:
Buys if the price drops by a specified percentage from the previous candle’s close. Only one purchase can be made within a single candle.
Condition to close a position:
Places a separate individual closing limit order for each purchase, or uses one common take-profit order for the whole position.
⚠️ Attention : Stop-loss is not implemented in the current first version of the strategy.
Options description:
Drop_percent , % — Percentage drop in price from the From point
From — The reference point on the closed candle from which the Drop_percent is calculated (Open, Close, High, Low)
Tp , % — Take-profit level as a percentage
Count — Number of allowed additional purchases (scaling in)
Each_tp — Mode switch:
True — a separate take-profit is placed for each purchase
False — one common take-profit is placed based on the average entry price of the position
7Lots v27Lots strategy
The strategy is a counter-trend with a return to the moving average. Based on the DCA strategy, but greatly simplified to 7 lots (limit orders) and using the default martingale x2.5
Strategy description
Two moving averages are used. The first MA can be used as a filter for opening a position and also closing if the second MA is disabled. If both are enabled, then the position is closed by the second MA, and the first is used as a filter. There is also a separate take profit and if the price does not reach it, the position will be closed when returning to the MA, which will act as a stop loss, but the risk of liquidation is still present since the strategy does not have a regular classic stop loss.
Main parameters
TP & SL - selection of closing a position only by MA or take profit + MA. If only MA is selected, the strategy ignores the take profit value and always closes the position by MA.
MA settings
MA length from 1 to 200
Sliding type ALMA, SMA, EMA, VWMA, WMA, RMA
MA data - Open, High, Low, Close, HL2, HL3, OHLC4, OC2
MA shift in %. The MA shift is set in % above or below the current prices. For the First MA, this function allows you to use it as a filter for opening a position. For example, if you specify a shift much lower, for example -1% or -2%, then there will be less noise for opening a position, but this affects the number of transactions.
DCA group settings
Take profit %. Set the take profit as usual, but if the price does not reach the take profit, then the closing will occur by MA when the price returns to its values.
Take profit from. There is a choice of take profit from the average position, or by closing the previous bar. The latter increases the profit factor, but also increases the risk of liquidation if the strategy is used on perpetual contracts or futures.
Position Entry % - specifies the condition for opening a position. 0% - opening will occur immediately. 2% - opening will occur when the price falls 2% below the bar closing if the Long mode is set. If Short, then vice versa.
Grid Scale - classic progressive grid step
Next comes the setup of lots as a percentage of the deposit. Simply specify how many percent of each lot will be used from the total deposit. By default, a percentage for each lot is already allocated according to Martingale with a multiplier of x2.5, but you can calculate your own. You can specify 0, then the lot will be disabled.
Leverage. By default, 1.
Extra lot. This is the 7th lot that I decided to allocate separately from the main grid, since it is not always really needed. And it is calculated from the last lot of the grid. You can set it to how much lower percentage of the last lot to set it for and also what percentage of the deposit it will use. If you trade futures, then this lot, as an auxiliary one, can greatly average the position in case of strong volatility in the market.
Next, you can specify the start and end dates of transactions.
The table displays the total percentage of the deposit involved in trading at the moment. By default, all lots and leverage are set to 100% deposit load. The table also shows the number of transactions of the last 5-6 lots and extra, so that you can understand how many of them there were throughout the history of trading and possibly draw some conclusions for yourself. Especially useful for extra lots. Max Historical Drawdown (%) shows the historical price drop at the moment from the average open position. This will make it possible to analyze what leverage this strategy could withstand over the entire trading history. The date of this drop is also indicated.
For novice traders, it is recommended to use only on spot without the risk of liquidation. It is also best to use large time frames to see the whole picture, but you can also use a minute chart, there are no restrictions, everything is in your hands.
Tips. If you use minute charts, it is better to greatly increase the length of the MA from 20 and above. Hourly charts from 1-7. It is better to set up on spot and if you need futures, then use the same settings from spot, but with correction for futures. This strategy does not work well in Short, but shows excellent results for Long even when the market falls. When selecting settings, take into account sharp market fluctuations, Max Historical Drawdown (%) will show you this information in the table. You need to set up from the first MA, when you set up for the best result, then turn on the second MA and transfer the settings of the first MA to the second. Then fine-tune both MAs. The results can increase significantly, but this is not always the case. Sometimes just one MA is enough
The strategy is paid, tested with my own experience and money since 2022. Own development for opening a position.

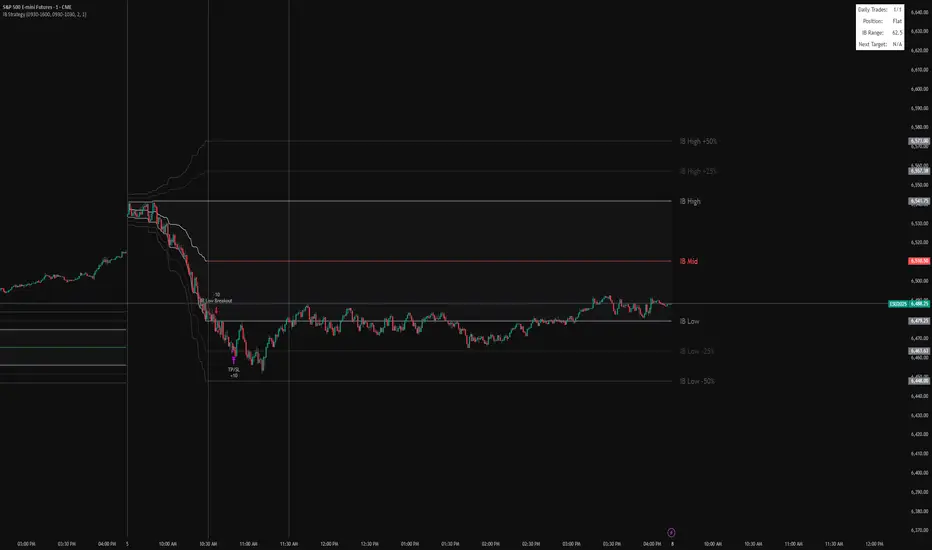
IB BreakoutIt marks the IB range (high, low, midpoint) from a chosen session window (default 9:30–10:30).
It plots the IB lines, midpoint (colored based on close), and extension levels (+/–25% and 50%).
After the IB session ends, it looks for breakouts:
Long if price closes above IB high.
Short if price closes below IB low.
Each trade targets the 25% extension in the breakout direction, with an optional stop at the opposite IB level.
It limits the number of trades per day and displays info (trades, position, IB range, next target) in a table.